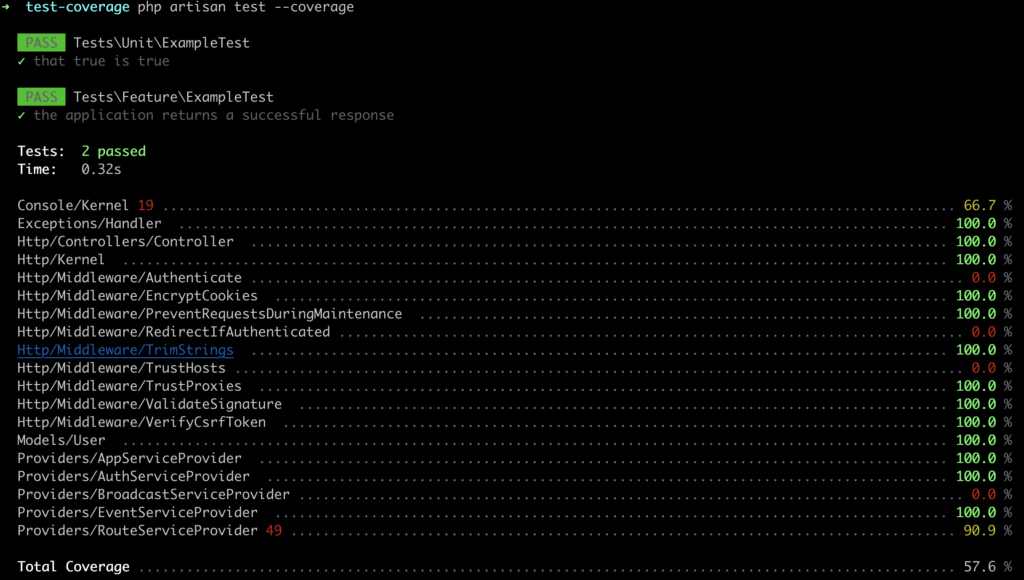
Laravel 9 supports getting code coverage reports with the command `php artisan test –coverage` in this article we are going to set up Xdebug locally and configure the code coverage feature in 3 steps.
Step 1: Install xdebug
By running the following command, check if you have already installed Xdebug in your system.
You should be able to see the version of Xdebug you have installed.

If you don’t see any mention of Xdebug, follow this guide to install Xdebug and get back to this article to continue the code coverage setup in the Laravel project.
Step 2: Set Xdebug mode
Edit the php.ini file
If you don’t know the path to `php.ini` file run the following command.

Then add/update the config to add the following line after `zend_extension=”xdebug.so”`
You can also add develop and debug modes if you want to use them. For more check the xdebug documentation.
Step 3: Run test coverage command
and you should see the coverage results now.

Step 4: Exclude files from the coverage report
From the screenshot above you can see the total coverage is just 57.6%, and a lot of framework files like middleware and providers are not fully covered. You can exclude these files and other files like traits or other files from your own code using phpunit.xml file which ships with Laravel by default.
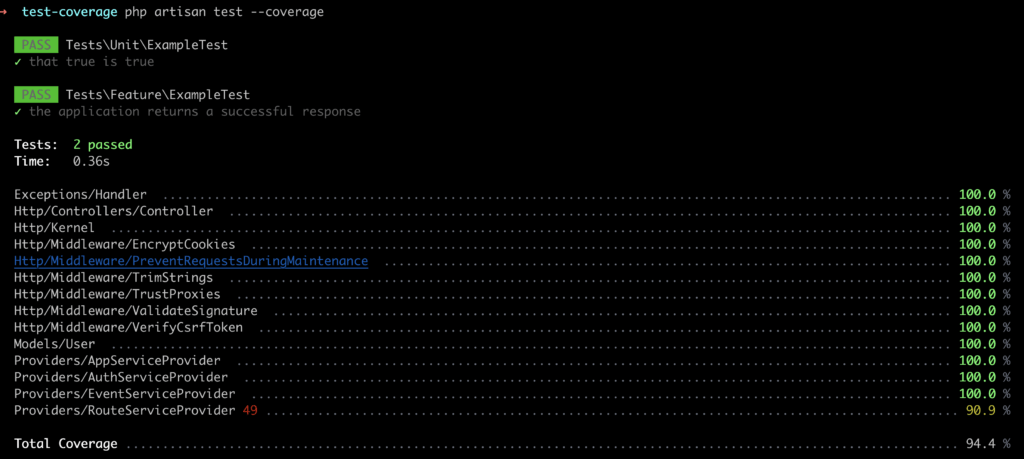
Add the <exclude> tag in the phpunit.xml and list down directories or files you want to exclude as below.
The code coverage is higher now.

It is important to focus on ensuring that your code coverage report only includes relevant files and excludes unnecessary ones, rather than simply trying to achieve the highest possible code coverage percentage. By excluding unnecessary files, you can get a more accurate and useful code coverage report that accurately reflects the coverage of your application’s code.
Here is some Code Humor to make your day.